|
Analog - Reading - Computer - Aided - Digital - Input - Analyzer
Last updated 9-3-2018
Printable Version
Because of Arcadia's fast logging rates, high resolution, and digital logging leaves many options open for data analysis. A note on the resolution, most A/D converters are 8 bit, showing only 256 steps of resolution, Arcadia's 10 bit A/D converter has 1024 steps of resolution - giving four times the measurement accuracy of an 8 bit converter. Similar systems may log their data digitally, but at very slow sample rates. The result is more time's worth of data in a smaller memory buffer, but, in the case of an anomaly lasting three seconds, you will only have three measured readings for the anomaly (one per second, at one hertz). Once the desired section of the graph is pulled to be analyzed, there isn't much you can do with only three measured readings that are of interest. A sample rate of ten hertz, however, will result in thirty measured samples in that three second time period (one per hundred milliseconds), and leave the analyst much more information about what exactly happened in that measured field. With Arcadia's higher sampling frequency, the possibilities of analysis are endless.
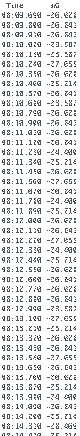
Once the data is obtained digitally, all you have is a text file with two tab delimited columns with the time, and channel reading, respectively. The first step in analyzing the data is obvious, put it in analog form that human eye can read easier, i.e., a graph. This can be done with any spreadsheet program (I use DeltaGraph), just copy and paste the two columns of data into the spreadsheet, and then have the program generate a line graph from them. Then, once the data has been graphed, just use your eye to look for any odd fluctuations. In my opinion, if a fluctuation isn't obvious to the human eye when graphed, it probably isn't worth considering as a substantial anomaly (unless the graph spells your name, if that's the case, please contact me immediately!). For anomalies that show very interesting fluctuations, the derivative of the anomaly can be calculated for further analysis.
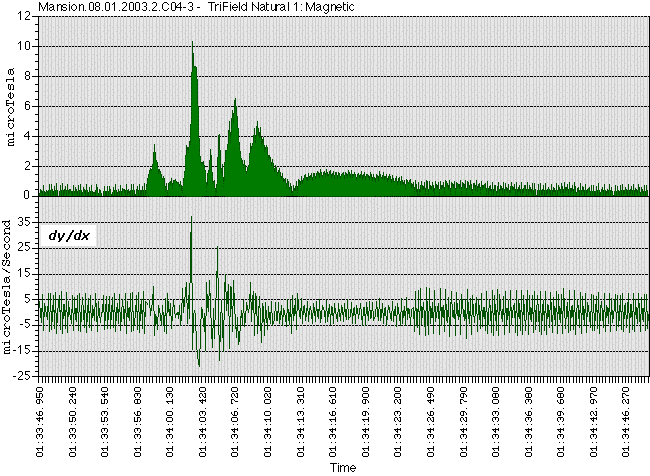
In calculus, the derivative is basically the instantaneous rate of change at any instant in time. This is calculated by finding the slope of the line tangent to the graph at all moments in time. In English - basically, the change in field strength, divided by how long that change took, in seconds. The change in field strength is the Y axis of the graph, and the time is the X axis, hence (delta y)/(delta x), or dy/dx for short, which is notation for the derivative (delta means "change in", so (delta y)/(delta x) literally means "change in Y, divided by change in X"). Because the data files already show their data at a specific rate, the tangent doesn't need to be calculated, just the slope of the line for all sets of readings. It is a tedious process, especially with data files that have thousands of readings, so I wrote a perl program to do it automatically. Now all I have to do is enter name of the data file into the program, and in less than a second, the derivative of all the samples is calculated and stored into another data file. The result is knowing the rate of change of an anomaly, for example, in degrees per second, at any moment in time.
The graphs and data files on the left are good examples of the data obtained by Arcadia at various stages of analysis. The raw data file is available to download here, and the calculated derivative of the data file is available here. Keep in mind that this data file is a REAL anomaly, recorded by Arcadia at the historic Overholser Mansion in Oklahoma City, while the building was completely empty (it's the largest local DC magnetic field shift Arcadia has ever recorded, period.). The top graph is the graph of the regular data file, and is a fine example of a digital file converted to an analog view that the human eye can understand. The graph below it is the derivative of the top graph, which shows the rate of change in microTesla per second. In the derivative graph, you can easily see when the field strength is increasing or decreasing (positive or negative rate of change, respectively), which makes the derivative graph of an anomaly a valuable tool in analysis.
As with all other investigative methods (photographs, video, handheld meters, etc.), correlation between two or more independent meters always helps in analysis. For example, a change in humidity and visible light at the exact same moment in time would be amazing to record. This helps in verifying and proving anomalies, and making sure that the fluctuation wasn't just a meter malfunction. Multiple correlating forms of data, especially in a high precision system like Arcadia is like the Holy Grail of anomalous data. For example, recording an air pressure change, static field change, visible light change, and a light anomaly on video at the same time would be amazing, and give enough data to help further this research (but let's face it, that doesn't happen, except for in the movies).
|
|