Click to view graphs from this area:
- AC Magnetic Fields Graph
- Static Magnetic Fields Graph
|
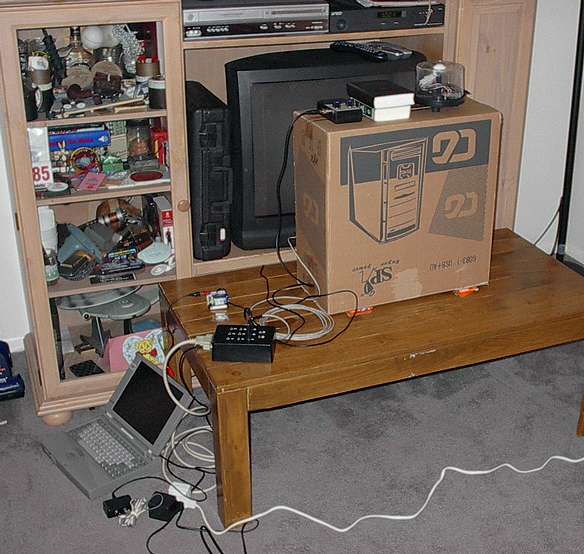
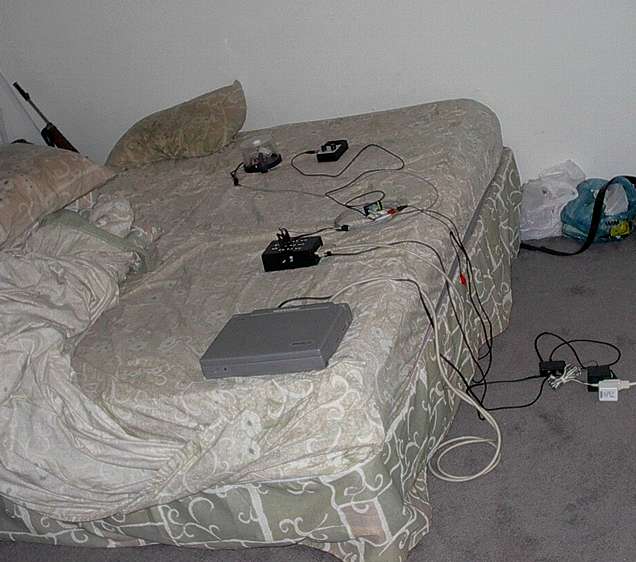
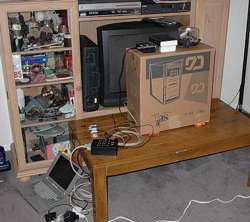
Measuring equipment was set up near the television (which was off), to get a view of the magnetic fields in the area that experienced RSPK activity the most. Static magnetic fields showed several interesting oscillations, in which I have never seen before in prior control runs. The graph starts with an odd frequency of ~.02 hertz, and around the 1,000 second mark, a small spike marks a new constant frequency of ~.04 hertz, which seems to slow down and then speed up again after several minutes. AC EM fields show semi-smooth transitions between 1.3 and 1.8 mG, with small spikes, normally of around .2 mG, which is fairly normal for an electronically dense area. As shown in the table below, both AC and static magnetic fields in the living room area show more statistical variance than typical control runs.
| Field Means, Standard Deviations (SD) & Control Log SD for Comparison |
| Field |
Mean Strength |
SD |
Typical Control SD |
| Static Magnetic Fields: N-S: |
-166.48 mG |
0.98 mG |
< 0.5 mG |
| Static Magnetic Fields: E-W: |
-216.01 mG |
0.723 mG |
< 0.5 mG |
| AC Magnetic Fields: |
1.58 mG |
0.144 mG |
< 0.09 mG |
|