|
|
|
| Investigation Held: | Measuring Equipment Used: | ||
| Date: Solar X-Rays: Geomagnetic Field: |
08-07-2004
Normal Storm |
AC EMF Fields (13 Hz -75 kHz): 3-Axis UHS AC EMF meter (AlphaLabs)
Electric Fields: Multidetector II Profi (Electrosmog.com) Static Magnetic Fields: Arcadia's Two-Axis Static Magnetic Field Meter Computer Logging Interface: Arcadia's A/D Converter | |
|
| |||||||||||||||||||||||||
Click to view graphs from this area: - AC Magnetic Fields Graph - Static Magnetic Fields Graph |
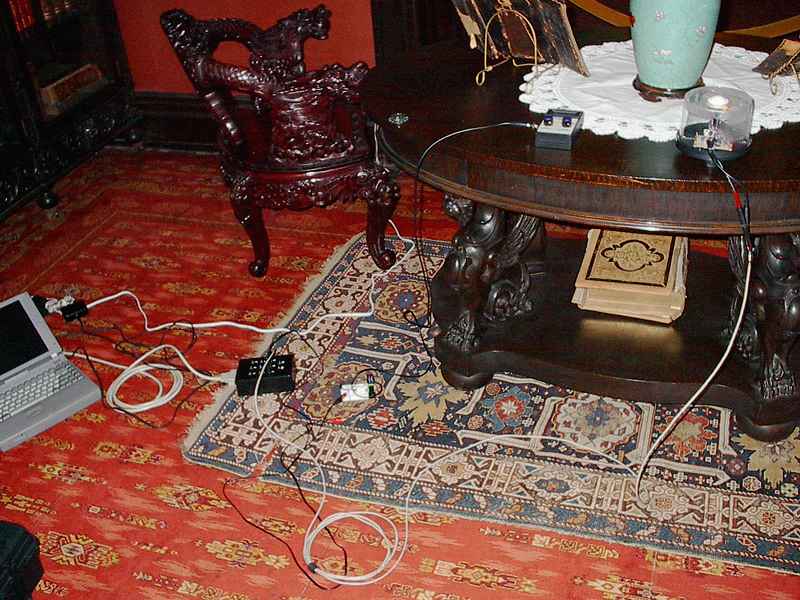
This was a follow up log for the large (10.5 mT) spike recorded on a TriField Natural meter during the second investigation, and also a control log for comparison to previous control runs in other areas (since little anomalous activity has been reported from this area). Measuring equipment was set up on the same table as the previous recorded fluctuation. Static magnetic fields showed minor fluctuations, mainly in the N-S axis, while AC magnetic fields show two large, nearly instantaneous spikes in field strength. The first spike, around the 1,835 second mark, jumps from .5 to .9 mG, and back down to about .6 mG. The second spike (3,595 second mark) was very similar to the first, peaking at 1 mG, both occurring within a 3 second time period. This could be due to nearby unseen electric appliances, such as an air conditioner, or other appliances that switch on and off sporadically. The spike field strength is very small (1 mG), but the quickness of the field change could trigger odd experiences. All EM fields showed less/equal variance (SD) when compared to previous typical control runs.
| ||||||||||||||||||||||||
|
| |||||||||||||||||||||||||
Click to view graphs from this area: - AC Magnetic Fields Graph - Static Magnetic Fields Graph |
Docent A reports feelings of uneasiness in this room, adjacent to the ballroom, currently being used as storage. Measuring equipment was set up in the center of the room, approximately 5 feet off the ground. Static magnetic fields show instability on both axis, along with small, smooth variances. Frequencies between .01 and .02 hertz are apparent, but these oscillations are short lived, not seeming to last more than a few minutes for each. AC magnetic fields show similar spikes as the Library area had, suggesting that the house may have poor shielding and grounding. These spikes were much larger, the first occurring at 80 second mark, up to 1.45 mG, which then drops back down to about .79 mG. This new baseline holds for about 10 minutes, when the field strength then drops to about .6 mG. Another large spike up to 1.45 mG at the 1,460 second mark starts a baseline of .76 mG. After another 10 minutes, the field strength drops again to .6 mG, which holds until a spike of 1.6 mG occurs (2,840 second mark), and a .8 mG baseline is established. Just before the graph ended, the baseline dropped to just above .7 mG. The process seemed to follow a pattern, each spike occurring exactly 23 minutes apart, the cause of which is unknown (as mentioned above, possibly an air conditioner or other appliance). Electric fields were much higher than normal in this area, in some places over 200 V/m, which can cause odd feelings such as tingling, goosebumps, etc.. EM variance in this area showed to be a little higher than typical control runs.
| ||||||||||||||||||||||||
|
| |||||||||||||||||||||||||
Click to view graphs from this area: - AC Magnetic Fields Graph - Static Magnetic Fields Graph |
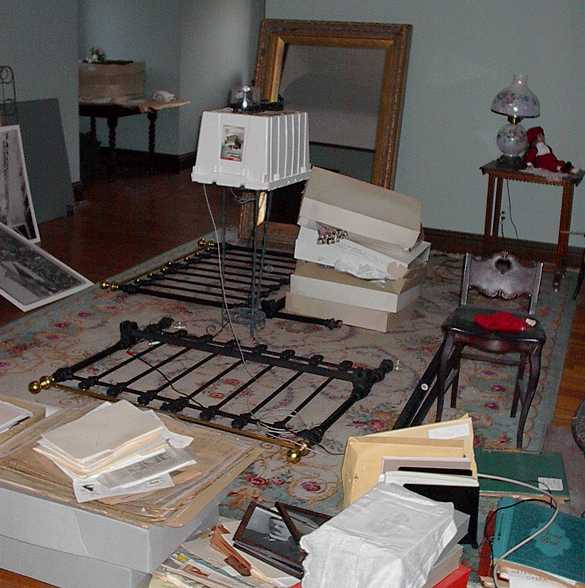
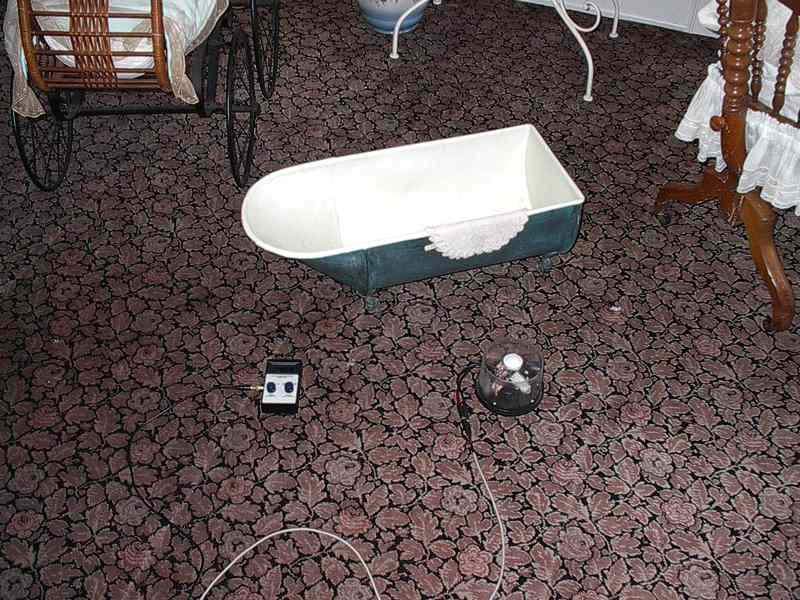
Reports from Docent A point to possible RSPK type movement of the miniature tub shown in the photo. To get an idea of the EM fields in the area of the bathtub, measuring equipment was set up on the ground adjacent to it. Very strong (9.6 mG) AC baseline magnetic fields were found, most likely due to 60 hz mains wiring under the floor in this area. These fields fluctuated between 9.2 and 9.8 mG at various frequencies, from .017 to .05 hertz. Static magnetic fields in the N-S axis showed a similar oscillation (.017 to .026 hertz), but each frequency is short lived, not lasting more than a few minutes. The odd frequency oscillation and high peak-to-peak strength (~5 mG) in the N-S axis is something that I've never seen before, and could possibly be due to aliasing, caused by the large field strength of 60 hertz magnetic fields (10 mG). Static magnetic fields in the E-W axis show a similar oscillation, but not as high peak-to-peak strength (< 3 mG). The very strong AC magnetic field (9.6 mG) is much higher than the recommended exposure level for most countries, which is typically 2-3 mG at 60 hertz. EM variance in this area showed to be a MUCH higher than typical control runs, particularly in N-S static magnetic fields.
| ||||||||||||||||||||||||
|
| |||||||||||||||||||||||||
Click to view graphs from this area: - AC Magnetic Fields Graph - Static Magnetic Fields Graph |
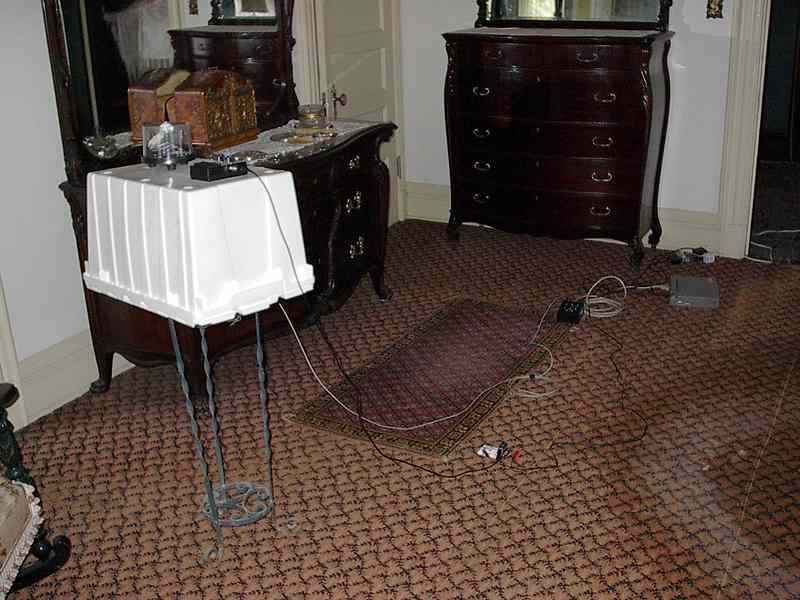
Docent A reported feelings of uneasiness in this room, particularly in one spot, near the bathroom. To get an idea of what kind of fields would effect the brain in this area, measuring equipment was setup 5 feet off the ground (this was the highest pedestal we could rig on-site without planning) at the same location where uneasy feelings were experienced. Immediately upon entering the area, I noted the smell of natural gas, which was then confirmed by Docent A, who said that the smell has been there for quite some time. It is unknown whether there could possibly be an old gas furnace in the area, but currently the mansion uses all electric appliances. This gas presence could be causing the feelings of uneasiness, as reported by Utilities Kingston gas/electric company, carbon monoxide in natural gas can "cause flu-like symptoms without a fever, including: headaches, nausea, dizziness, drowsiness or fatigue, burning eyes, confusion and loss of coordination". AC magnetic fields in this area shown minor fluctuations in the baseline, and just a few notable spike of about .15 mG above the baseline. Static magnetic fields showed some minor temporal changes of about 3 mG, with little oscillation compared to the graphs of other areas. At the beginning of the log, the N-S static magnetic field baseline shifted down about 2 mG, which could be due to the storm geomagnetic activity at the time. EM variance in static magnetic fields showed to be a higher than typical control runs, particularly in the E-W axis.
| ||||||||||||||||||||||||
| Room resonant frequencies at 72 F | Room resonant frequencies at 72 F | ||||
| Area | Measurement | Resonant Frequency | Area | Measurement | Resonant Frequency |
| Monroney to Master Bedroom (wall to wall) | 51' | 11.10 hz | 3rd Flr, Ballroom to Exhibit Cases room (wall to wall) | 57' | 9.23 hz |
| Nursery | 12' x 20' | 47.16 x 28.29 hz | 1st Flr, East Entryway, E-W (wall to wall) | 40' | 14.15 hz |
| 1st Flr, Piano Room to Library, N-S (wall to wall) | 52' | 10.88 hz | 2nd Flr, Guest Bedroom to Stairway wall, E-W | 45' | 12.57 hz |